Jeffrey D. Fisher, Ph.D.
I recently reported on current trends in the commercial real estate market based on data from the National Council of Real Estate Investment Fiduciaries (NCREIF) who’s members are large institutional investors that collectively own or manage over a half trillion dollars of properties. Readers may be wondering if those trends are applicable to the properties that RealNex clients deal with on a regular basis.
To explore this, we have aggregated data that has been provided by RealNex clients over the past 30 years. Yes, although RealNex was only formed a few years ago, several of the companies acquired by RealNex have been in business for over 30 years and have data on listings and comparable sales (comps) that go back to at least 1985. This data can help our users better understand trends in real estate markets that benefit everyone.
The following exhibit is a comparison of the price per square foot for the NCREIF properties vs. those in the RealNex database. All property types are combined including office, retail, warehouse and multifamily properties to capture major trends in these two categories of properties. Keep in mind that the average size of properties varies considerably between the two databases with the NCREIF properties averaging around $30 million and the RealNex properties averaging around $4 million over this period. This could be thought of as comparing properties held by large institutional investors with those held by private individual investors.
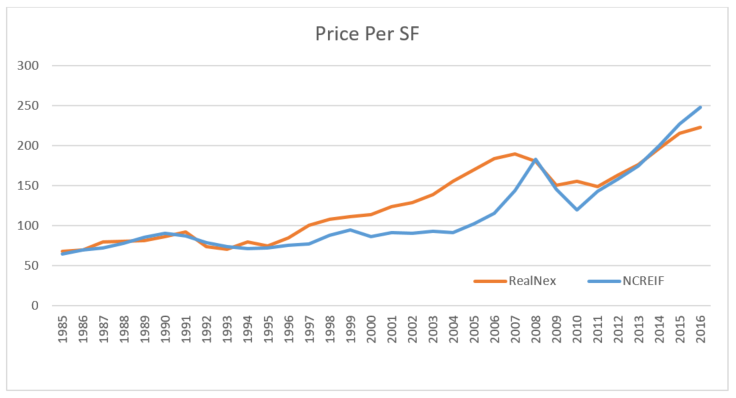
What is surprising is how similar the price per square foot is. In fact, they start off virtually identical in 1985 and track very closely until about 1987. Then the price per square foot rises faster for the RealNex properties until just before the financial crisis began in 2008. What is particularly interesting is that the price per square foot starts dropping first for RealNex properties before the NCREIF properties. There are two explanations for this: 1. The smaller properties were affected first by the tightening by lenders. 2. The RealNex data is based on actual transactions whereas the NCREIF property values are based on appraisals.
The NCREIF properties fell further in price per square foot during the financial crisis. This is somewhat surprising. The institutional fund managers may have been selling off their winners to try to improve their performance reporting to investors as much as possible.
In more recent years, the price per square foot rose higher for the institutional real estate. Many market observers have considered these properties priced for perfection and concerned about them having reached a peak. Note that the RealNex price per square foot has shown a softening. They haven’t fallen in price, but are not increasing quite as fast this past year compared to the NCREIF properties. Remember that they showed the first signs of a decline during the great recession. So this is more consistent with what most observers believe is occurring in commercial real estate markets.
This is a first attempt at using the RealNex data to help our users understand market trends that may impact their business and that of their clients. We hope to bring you more over time as we all work to have better transparency in real estate markets.
Want to learn more about the RealNex platform? Sign up for a demo for a full walk-through.