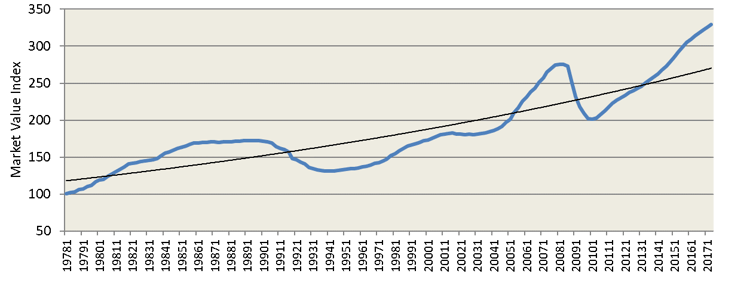
Although the rate of price appreciation has moderated the past two years, it has still been positive and values have continued to reach new highs for commercial real estate as measured by the NCREIF Market Value Index (MVI). NCREIF tracks the performance of over $500 billion in commercial real estate owned by institutional investors in the US and includes all the major property types (apartment, office, industrial, retail and hotel). The following graph shows the quarterly value indexed at 100 in the first quarter of 1978. The value is also above a long-term trend line shown in the graph.
NCREIF Market Value Index (MVI)
It is also noteworthy that the rate of return (income plus change in value) for the NCREIF Property Index (NPI) increased for the most recent quarter after eight quarters of consecutive decline. The following chart shows the quarterly returns on an unleveraged basis since the first quarter of 2015.
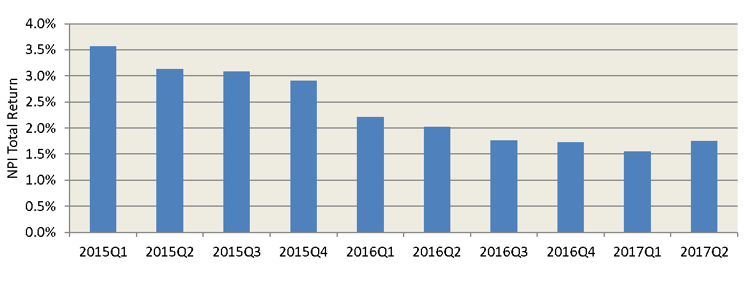
The 7,161 commercial properties, totaling $539.2 billion of market value, had a 1.75% total return in the second quarter 2017, up from 1.55% last quarter.
When viewed by property type, the winner was industrial properties which is primarily warehouse space. The strong performance of this sector is largely due to the demand for warehouse space for internet shopping – especially so called “last mile delivery” such as space used by Amazon Prime Now.
NPI Total Returns by Property Type
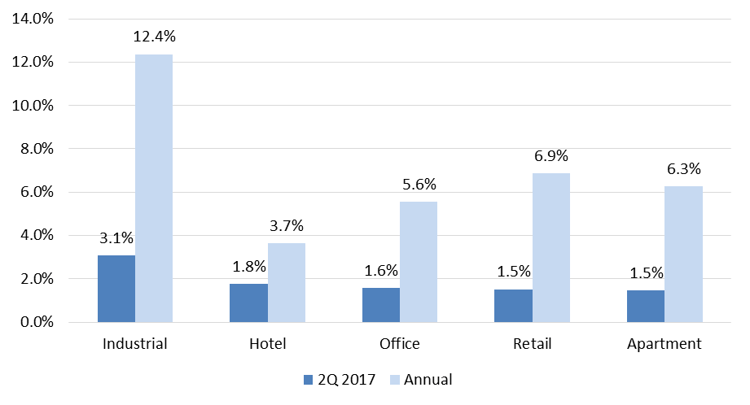
A polling of institutional investors suggests that they expect this sector to continue to outperform the market.
Other NPI property types trail by a wide margin in the second quarter, with the hotel total return at 1.76% and the remaining property types returning about 1.5% each.
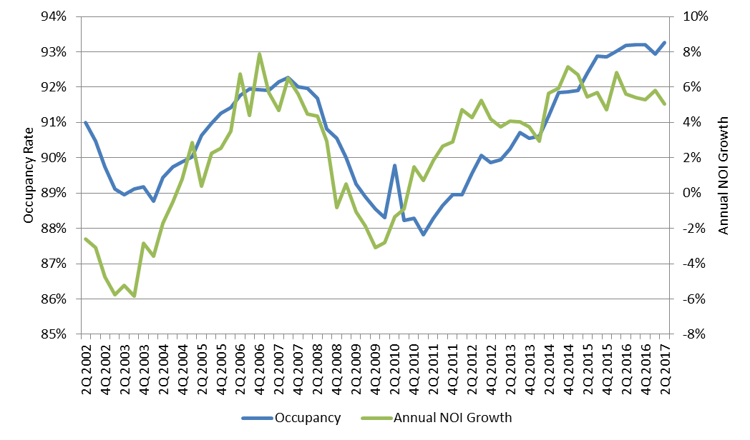
Space market fundamentals remain strong among NCREIF-tracked properties. Occupancy rose to a new 16-year high of 93.3% in the second quarter, from 93.0% last quarter and 93.2% a year ago.
Net operating income (NOI) growth was 5.1% (including hotels) for the trailing year, remaining above its 3.2% long-term annual pace. Industrial holds the lead for annual NOI growth, at 7.5%, followed by office at 6.7%.
NPI Occupancy and Net Operating Income Growth Trends
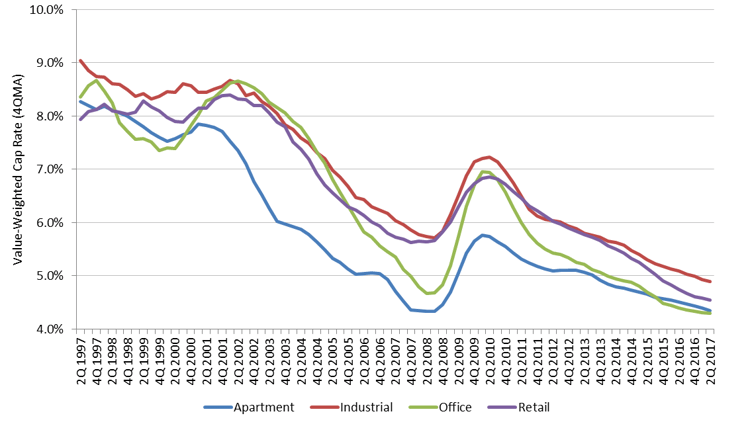
Reflecting steady demand for institutional-quality assets, the cap rate remains near historical lows at 4.47% in the second quarter, up marginally from 4.44% last quarter. By property type, only retail saw quarterly cap rate compression with a 12 bps decline to 4.45%. Office had a 13 bps increase to 4.42%, while apartment and industrial only edged up by a few bps each, to 4.35% and 4.86%, respectively.
NPI Implied Appraisal Cap Rates by Property Type
All things considered, most institutional investors feel that the current level of performance is sustainable for the remainder of this year, and they do not see a recession over the next couple of years. We do not appear to have the over building and over leveraging of CRE that triggered previous recessions. Whether cap rates will rise as the fed increases interest rates is a concern, although most don’t believe cap rates will rise as fast as interest rates. Stay tuned.
Need help with your own property financials? We'd love to talk with you about our CRE-specific solutions. Sign up for a demo today!


